STM32/ARM Cortex-M3 HOWTO: Development under Ubuntu (Debian)
Basic gdb with OpenOCD
Let's continue with the Olimex blinky example.
cd ~/stm32/stm32-example/projects/stm_h103/
make clean
make
wget http://fun-tech.se/stm32/OpenOCD/openocd.cfg
Connect the hardware and start the OpenOCD server.
xterm -e "openocd -f openocd.cfg" &
Then connect the telnet session.
xterm -e "telnet localhost 4444" &
In the telnet session we flash the system again and leve it in reset.
reset halt
flash probe 0
stm32x mass_erase 0
flash write_bank 0 main.bin 0
reset halt
Start gdbtui
Then it is time for gdb
arm-none-eabi-gdbtui --eval-command="target remote localhost:3333" main.out
At this point you should see something like this.
GNU gdb (GDB) 7.0
Copyright (C) 2009 Free Software Foundation, Inc.
License GPLv3+: GNU GPL version 3 or later <http://gnu.org/licenses/gpl.html>
This is free software: you are free to change and redistribute it.
There is NO WARRANTY, to the extent permitted by law.  Type "show copying"
and "show warranty" for details.
This GDB was configured as "--host=x86_64-unknown-linux-gnu --target=arm-none-eabi".
For bug reporting instructions, please see:
<http://www.gnu.org/software/gdb/bugs/>...
Reading symbols from /home/cj/stm32/projects/stm_h103/main.out...done.
Remote debugging using localhost:3333
main () at main.c:39
(gdb)
Now check what status the system is in with
mon reg
info frame
Check so the pc is correct, it should be something like this:
(15) pc (/32): 0x00000011 (dirty: 0, valid: 1)
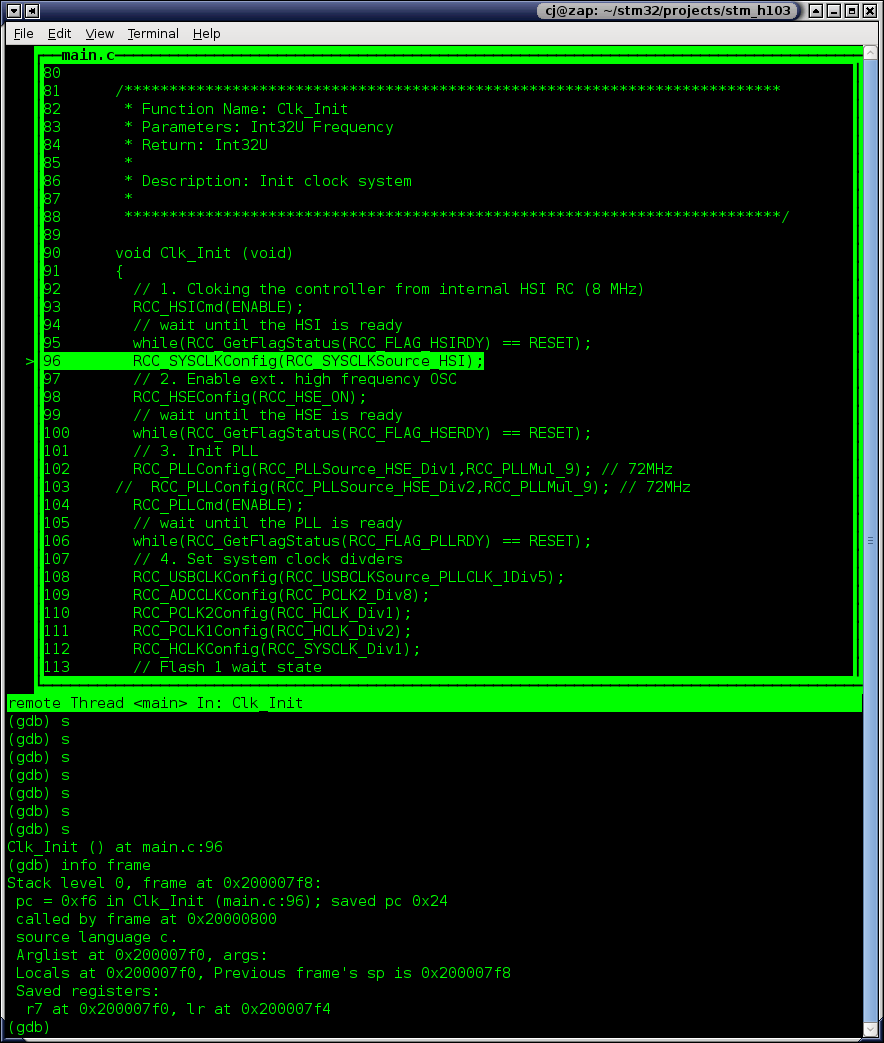
Now we can step and check again, notice that after 2-3 steps we "enter" the "real" code and the source window updates when we step.
s
info frame
s
info frame
....
So now you have something that looks a litle bit like this:

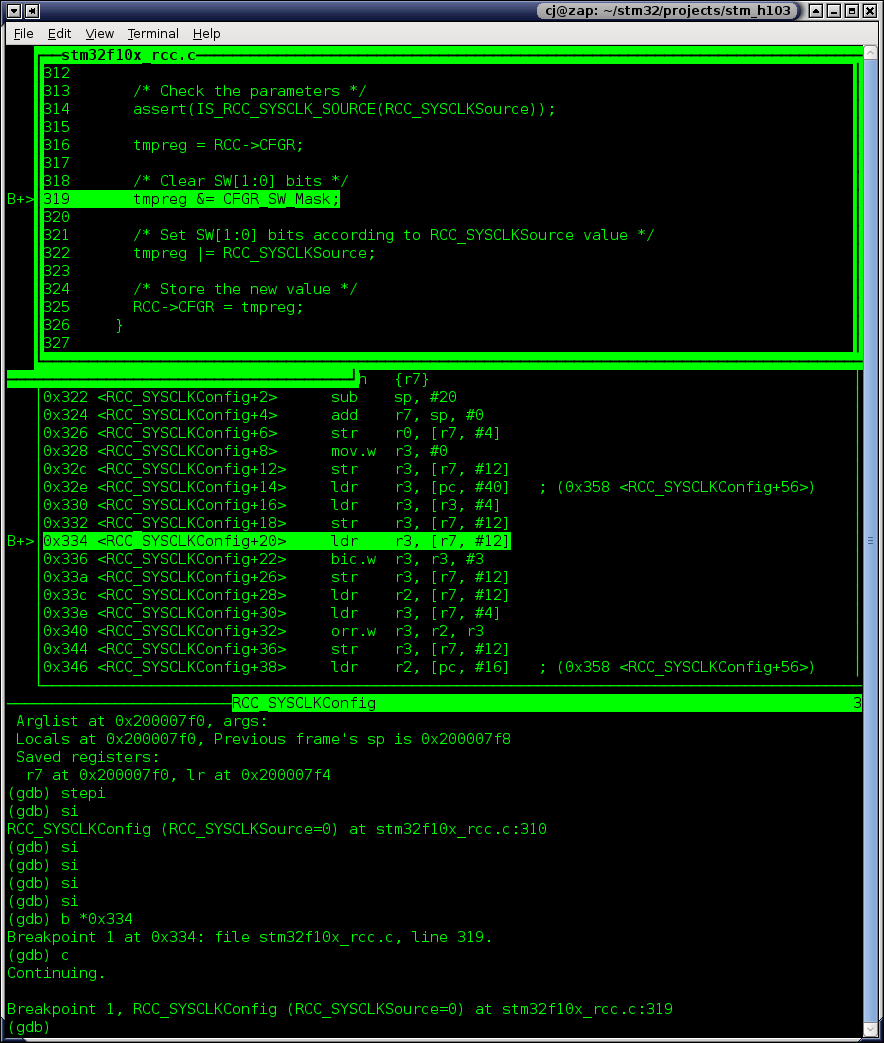
But how what's to step c-code anyway? let's look at both assembler and c-code and single step instructions with "stepi".

If you wan't to read more on the gdb tui interface, here is a good link.
http://ftp.gnu.org/old-gnu/Manuals/gdb-5.1.1/html_node/gdb_192.html#SEC197And one more thing. Even if you don't like text based gdb sessions, it could be good to know that they are very useful over ssh sessions...
ddd
If you like ddd, you can just start that instead of gdbtui:
ddd --eval-command="target remote localhost:3333" --debugger arm-none-eabi-gdb main.out
Insight
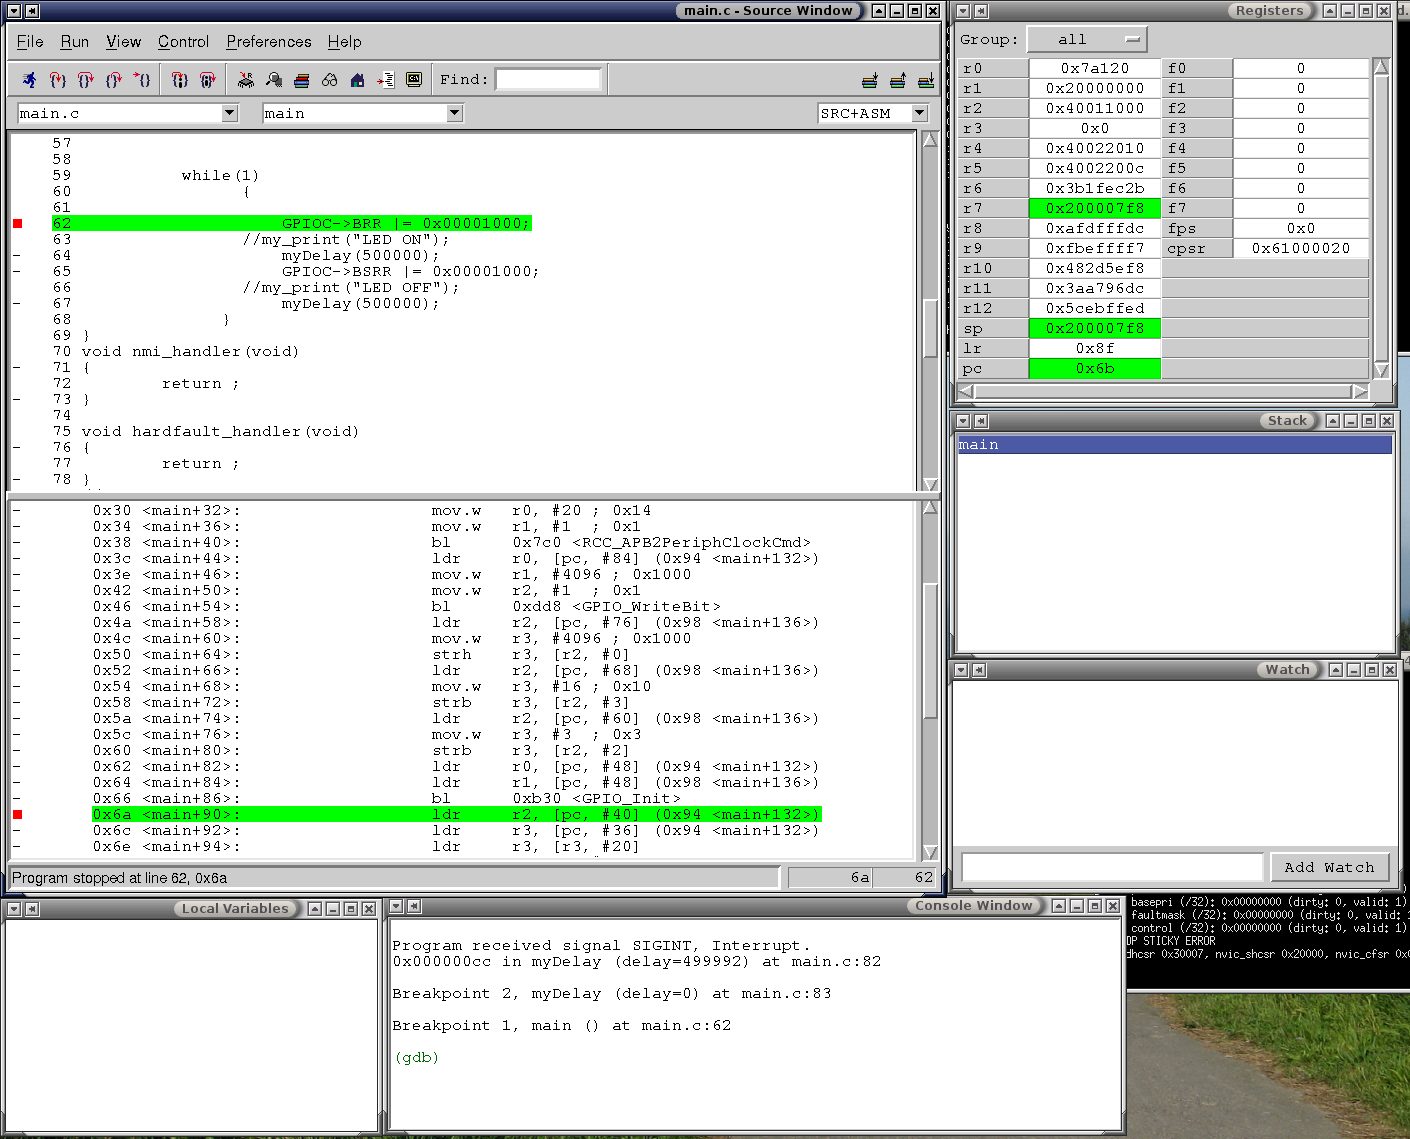
But right now I recomend to use Insight, that is a quite nice little gdb frontend.
arm-none-eabi-insight --eval-command="target remote localhost:3333" main.out

Don't forget to enter a external editor, and tab size. Under "Perferences"->"Source" you will find a field called "External Editor", there you could enter:
gvim %s +%d
And now if you will end up in the right file at the right line number.
kgdb
Then we have another nice gdb frontend called kgdb.
You need to start it first edit Settings->Global options and change the option "How to invoke GDB" from "gdb --fullname --nx" to "arm-none-eabi-gdb-7.1 --fullname --nx".
Then you close and reopen with this command line
kdbg -r localhost:3333 main.out
Happy debugging :)
Fatal error: Uncaught Error: Call to a member function link_ext() on null in /customers/9/b/5/fun-tech.se/httpd.www/stm32/class.page.php:62 Stack trace: #0 /customers/9/b/5/fun-tech.se/httpd.www/stm32/OpenOCD/gdb.php(360): page->getFoot() #1 {main} thrown in /customers/9/b/5/fun-tech.se/httpd.www/stm32/class.page.php on line 62